Q3 financials are always hard to read because often there is no underlying trend with the summer season usually the quietest in the video game year. The financial results for calendar Q3 2021 make it one of those years.
Software Revenue
Chart 1 shows software revenue only. All revenue amounts have been converted to US dollar using a fixed exchange rate of ¥113 to $1 USD (Yen to US Dollar) and €1.15 to $1 USD (Euro to US Dollar), Sony and Nintendo hardware and peripheral income have been excluded and mobile data King sales have been removed from Activision Blizzard numbers.
Chart 1
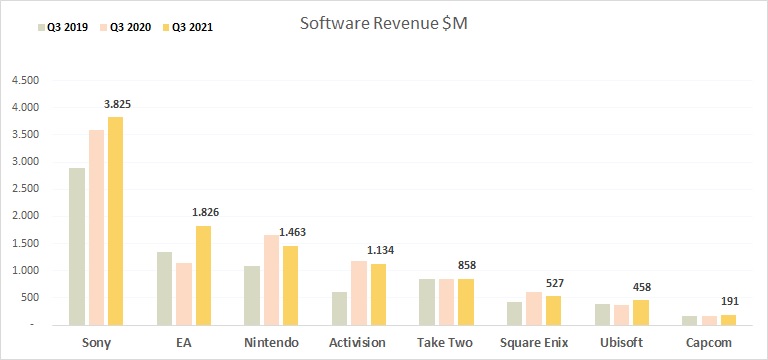
Of the eight companies tracked, five saw an increase in revenue compared to the Q3’20 calendar fiscal. This is an impressive achievement in light that the pandemic sustained a high level of spending throughout 2020. Sony reigned king with almost $4 billion in revenue derived from first-party games and commissions and license agreements with third-party games. EA has also performed exceptionally well with a +27% increase in Live Services income and a +26% increase from full game sales – see graphic below. In their results, EA highlighted that over 100 million players have engaged with EA Sport games and Apex Legends has seen its player base grow to be the highest for that game.
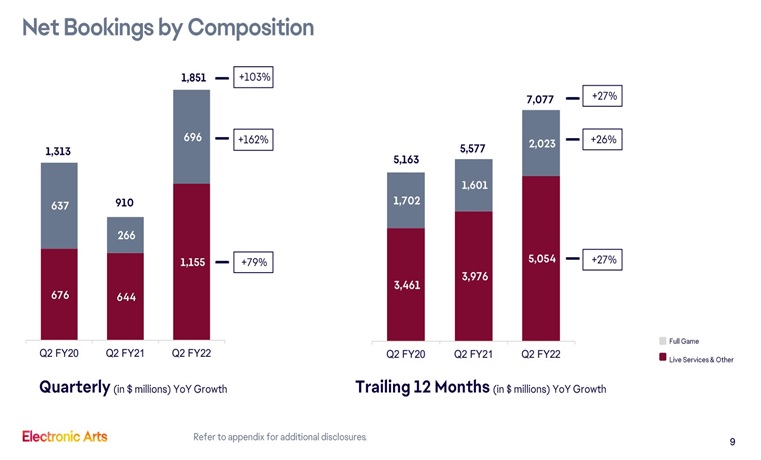 Earnings Slides, Electronic Arts Q3 2021
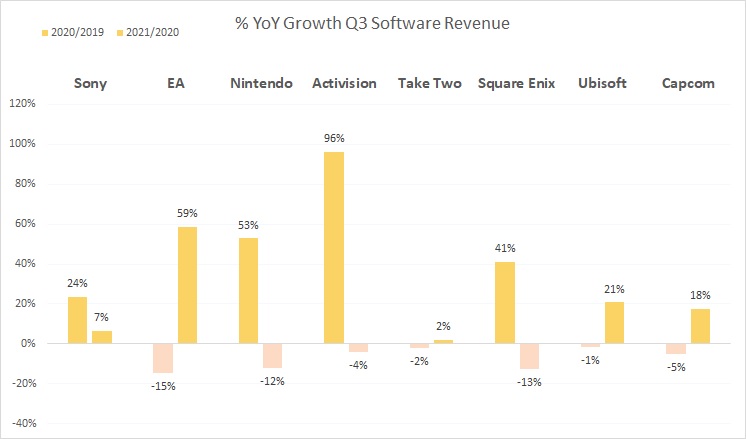
Ubisoft and Capcom also experienced double digit growth in Q3’21 but growth for either company was less than half that for EA, which saw a +59% increase in spending, See Chart 2:
Chart 2
Software Net Income
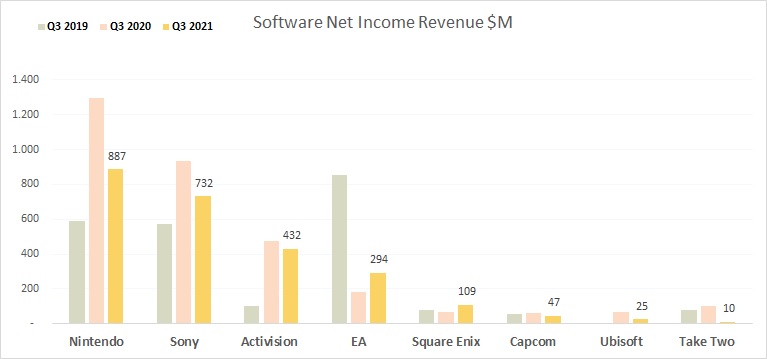
With the benefit of license revenue and commissions, Sony and Nintendo generated the highest net income in Software. In Chart 3 you can see they respectively earned $887 million and $732 million, more than double Activision and almost three times that for EA. With high cost of sales and general administration fees, Ubisoft and Take Two are both just north of breakeven with $25 million and $10 million respectively. It should be noted that although some publishers experienced a year-on-year downturn in net income, specifically Take Two (-90%), Ubisoft (-61%), Nintendo (-32%), Capcom (-26%), Sony (-22%) and Activision (-10%), none of the tracked publishers showed a loss during the quarter.
Chart 3
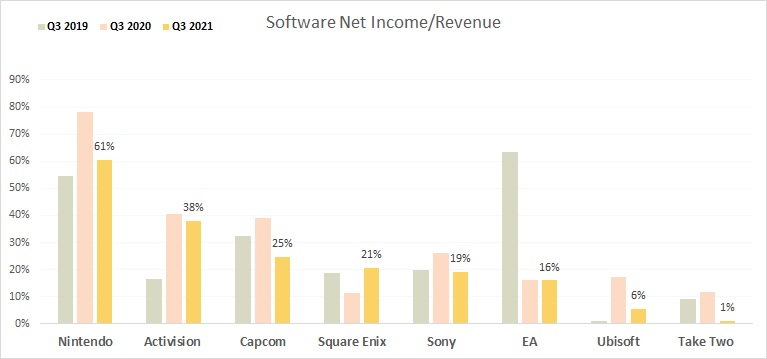
When comparing net income to total sales revenue for Software, the picture changes again, see Chart 4. Nintendo leads the way with 61% net income revenue to total sales, followed by Activision with 38%, Capcom with 25% and Square Enix with 21%. So, although Capcom and Square Enix have a more modest sized income compared to the likes of EA and Ubisoft, they have proven to have stronger profit margins. EA has seen its net income to total sales decline the sharpest when it had a 63% margin back in Q3’19, only for it to fall to 16% in the last two years. The high margin in Q3’19 was due to the fact EA received a huge $570 million tax rebate. The higher income which EA earned in Q3’21 did not translate with a strong margin due to growing costs for the company.
Chart 4
Digital Income
Chart 5 illustrates how much spending is done on the digital format. Activision’s number excludes King mobile revenue. Of the six publishers who publicly disclose digital data numbers, Activision’s revenue plateaued, and Ubisoft and Nintendo experienced a decline, even though their total software revenue increased, year-on-year.
Chart 5
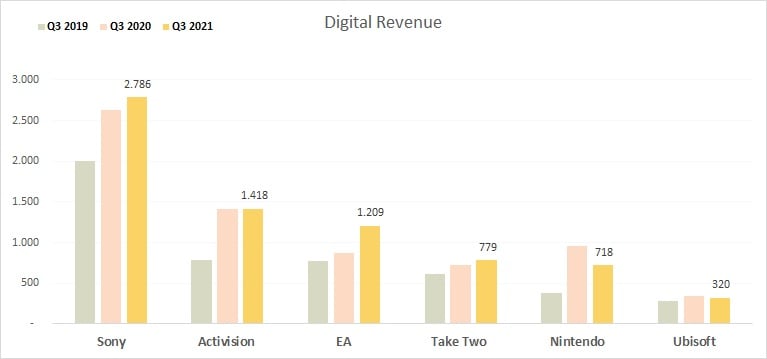
Chart 6 explores digital spending as a share of total software revenue.
Chart 6
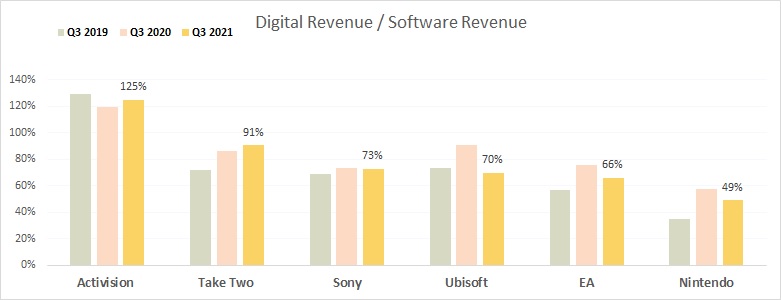
Activision is showing above 100% due to the fact it receives income from licenses and royalties from online events. Nintendo has seen the highest level of growth. Digital revenue for Nintendo accounted for 35% of total software revenue back in Q3’19 to increase to 49% by Q3’21. That is a 14-percentage point increase in the “digitalization” of its income in just two years. Almost all Take Two’s income comes from the digital format due to its Live Services from games such as NBA 2K, GTA V Online and Red Dead Redemption Online as well as strong back catalogue sales for GTA V from online stores.
Summary
Q3’21 is pretty much a mixed bag of results depending on when publishers release their games. For third-party publishers with strong Live Service products, they are currently sustaining healthy revenue income, but the cost of servicing these games is eating into their margin. These publishers may be making money at the top level, but their bottom line is far from booming.