These are troubling times. The UK economy is on the brink of a recession. We have an energy crisis and stubbornly high inflation of 9% (with forecast of peak 11%), which the Bank of England is trying to cool with higher interest rates. This, along with geopolitical uncertainty, is helping to slow the economy. According to the Office of National Statistics, the UK’s statistical agency, GDP fell by 0.3% in April 2022, after a decline of 0.1% in March 2022. Two consecutive quarters of decline in GDP signifies a recession. We may already be there as GDP is a backward-looking indicator.
Forward-looking indicators aren’t encouraging either. Consumer confidence has weakened over the last few months as concerns rise over the cost of living. Weakening confidence also reflects an expected increase in interest rates which will adversely impact disposable income going forward. Constrained consumer demand can also be seen in slowing business activity.
For many video games can be the perfect route for escapism from all this dreary economic news, albeit for fleeting moments. Given how everything is getting more expensive, video games are beginning to look like a great bargain, especially if they offer hundreds of hours of entertainment for the price of a family trip to the cinema. Recently however there has been some worrying comments from the games media, including articles from the GI website , that the impact of the pandemic during 2019-2021 has taken its toll on game releases. You only must glance at the number of titles released this year, compared to previous years, to get a feeling that momentum in game sales has slowed down. On SIFTD’s excellent channel, GameFace, Shane and Mat have repeatedly expressed concern that weeks have flown by without a tentpole game release. So, the question is – have fewer releases impacted overall sales and does it mark a problem for the industry at large? One of the best ways is to examine six data points – number of new games released, trends in full-game total game unit sales and in new releases, the financial disclosures of publicly traded publishers, their share prices and how much streaming gamers are watching or broadcasting this year.
Number of new games
Firstly, let us examine how many new titles in the UK have released so far in the first 22 weeks of the year. To keep things relevant, only titles that sold more than 10,000 units during its release week will be counted. Based on ISFE’s Games Sales Data (GSD) in 2020 there were 18 titles that sold in excess of 10,000 units in their respective release week, in their combined physical and digital format. In 2021 that number fell to 16 titles, but for 2022 it had increased to 20 titles, the highest among the last three years.
Trends in units sales
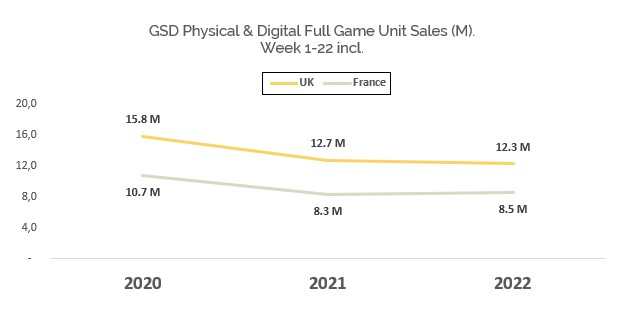
It would be tempting to extrapolate this trend and believe 2022 should see an increase in overall sales given the number of tentpole titles released, but unfortunately, things are not that simple. In the second comparison, when looking at total full game sales which include catalogue games, the story is different.
The UK saw a 4% decline in total full-game unit sales (GSD tracked physical and digital formats combined) from 12.7 million units in 2021 to 12.3 million units in 2022. The contrast to total unit sales sold in 2020 is even more striking with 2022 down 22%. This situation is not unique to the UK. In France unit sales for the first 22 weeks of 2022 increased by 3% (from 8.3 million units in 2021) but were down by 21% compared to sales in 2020. When looking at the last three years the good news is that the “post-pandemic correction” seems to have occurred mostly last year. Sales in 2022 have somewhat plateaued compared to those in 2021. So, although it may feel like 2022 is a lighter year in terms of total sales this is not really the case.
Unit sales from the first week of release
The third analysis are unit sales from the first week of release for new games during the first 22 weeks of the year. Compared to 2021 UK unit sales in this category increased by 132% to 1.6 million units. This higher than double growth was also seen in France which saw a 128% year-on-year increase to 1.1 million units. The first 22 weeks of 2022 even beat the equivalent in 2020 with UK sales at 67% higher and French sales 71% higher.
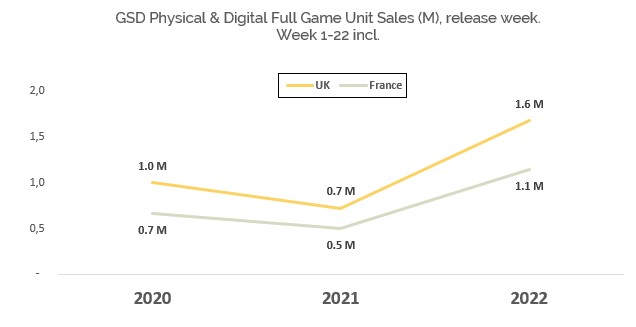
The increase in sales during 2022 was thanks to the release of Elden Ring, Lego Star Wars: The Skywalker Saga, Horizon Forbidden West, Pokémon Legends: Arceus and Gran Turismo 7. These five games each had a successful launch week that surpassed 100,000 units in sales. By contrast, there was just one game to release in 2021 (by week 22 of that year) with over 100,000 units in its release week (Resident Evil Village) and only three games in 2020 (Animal Crossing: New Horizons, Final Fantasy VII Remake and Resident Evil 3).
The feeling that the first half of 2022 has under-achieved could be due to the schedule of these game releases. May and June feel light because there was only a 11-week window between late January and early April that saw the release of Pokémon Legends: Arceus and Lego Star Wars: The Skywalker Saga, the two games which bookended the release of those five tentpole games. Instead of being spaced out throughout the first half of the year, these games all released in close proximity to each other. As a result, the year started very strong, but then fewer “big” games released subsequently. The question as to whether overall unit sales in 2022 would be higher than in 2021 if these tentpole games were released with a more sporadic timetable is unknowable. Personally, I am doubtful.
What we do know is that the goodwill of these new game sales was offset by declines in catalogue spending, a trend that continued since 2020. Catalogue spending (games released in the previous year) in 2021 was down 19% on 2020. This was followed by a further 20% decline this year when compared to 2021. Given the pandemic induced demand for games during the lockdowns, this type of correction was unfortunately going to happen when the pandemic receded, and people did not need to rely on games when stuck indoors.
Publicly disclosed financials
The fourth way to ascertain the health of the industry is to quickly glance at the publicly disclosed financials of publishers. There are numerous ways at looking at a profit and loss statement, for this exercise I will only explore top line revenue from a straw sample of six publishers namely Activision Blizzard, EA, Take-Two, Sony (PlayStation division), Nintendo and Ubisoft. The table below details their Q1’22 calendar revenue results and a year-on-year comparison to Q1’21.
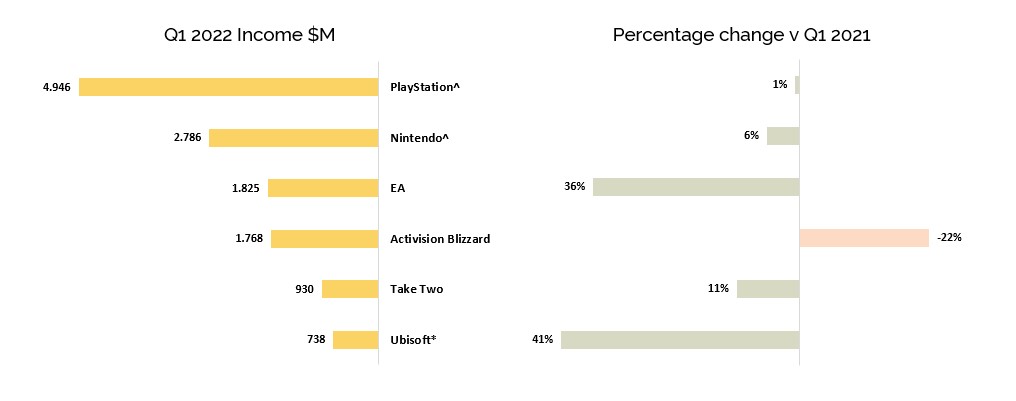
F/X ^¥134 = $1 *€0.96 = $1
With the exception of Activision Blizzard, each publisher will have their own reasons as to why they saw revenue increase in Q1’22 compared to Q1’21, but the underlining trend for many was an increase in digital revenue mostly from live services and microtransactions. This DLC revenue stream supplements the gaps when new games are not released or, in the case for the console manufacturers, when hardware sales have declined. It is undeniable that the growth in DLC spending has been the greatest disrupter in revenue planning for the industry in the past decade. By all indications that growth is not expected to wane in the foreseeable future.
This DLC revenue stream supplements the gaps when new games are not released or, in the case for the console manufacturers, when hardware sales have declined
Share price appraisal
The fifth analysis is share price appraisal. We all know that stock markets are volatile but share prices can serve as a rough barometer on the health of a company and state of an industry. I must emphasise that this part of the article does not serve as advice on whether to buy or sell stocks, it is merely an exercise of comparing how well publicly traded stocks in the game industry have fared against stock market indexes and crypto currencies (which have been the darling of speculative traders). Below is a snapshot of the global equity markets, Bitcoin and Ethereum, and the share price of the publicly owned AAA publishers. The prices are taken on trading day 2nd January 2022 and six months later on the 3rd June 2022 (week 22). If you are interested to read more on why stock markets have experienced volatility these past months, this is covered by Damian Abrahams analysis Prepare For Modest Video Game Stock Returns This Year on Seeking Alpha.
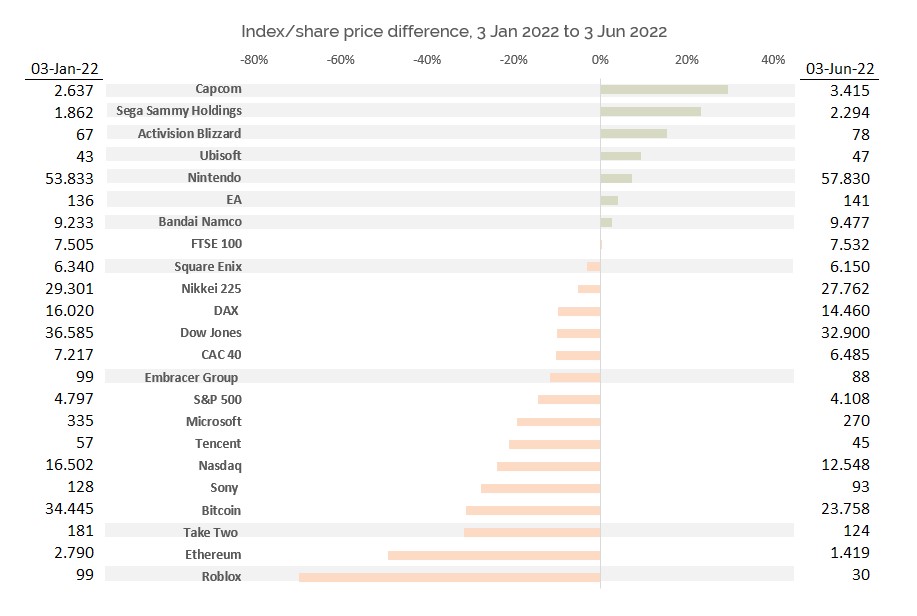
All the grey highlights are dedicated video game publishers. From this small sample we can see that apart from the FTSE 100, all growth indexes are video game publishers, companies that performed better than average stock markets such as Dow Jones, Nasdaq and the S&P 500, as well as cryptocurrencies Bitcoin and Ethereum. Obviously not every video game company saw growth. For example, Roblox’s share tanked, and Take Two’s share also experienced a negative swing. When analysing share price over a shorter time there is greater volatility as other factors come into play such as quarterly financial results, performance of newly released games, announcements (or lack of) of future games and statements made by CEOs, etc, but on balance, the growth in share price reflects confidence by investors in video game companies. When looking at the share price since the start of the year, these companies are currently bucking market trends.
Video game streaming
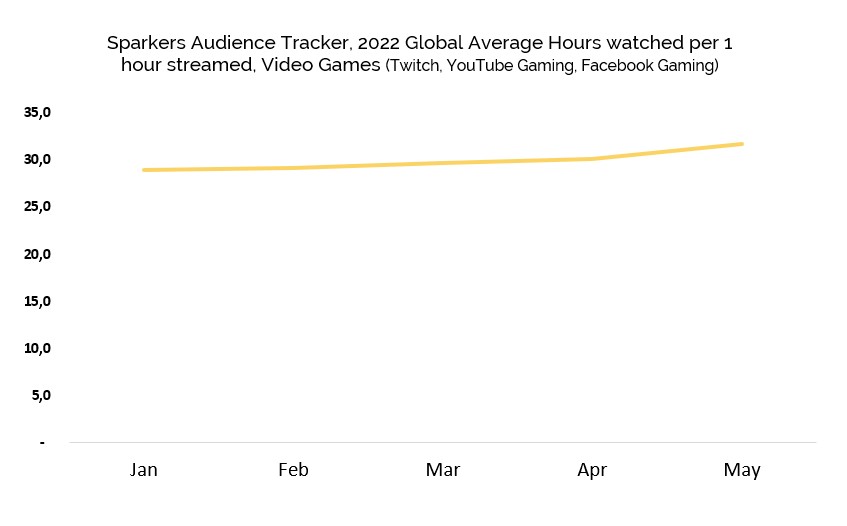
The final and sixth analysis is to delve into video game streaming. In many ways publishers are just as keen to understand how much their games retain DAUs and MAUs in the hope that retainment transforms into monetary reward, essentially converting players, or in this case viewers, into payers. Sparkers has a tool called Audience which collates, monitors and analysis streaming channels. The chart below is data collated from Audiences.
The chart tracks worldwide average hours watched (just purely on video game content) against the total hours broadcast on Twitch, You Tube Gaming and Facebook Gaming. In the first five months of the year, global engagement has increased from an average of 28.9 hours in January to 31.6 hours in May. This year every month has seen an increase in average video game watching than the previous month, making for a Cumulative Monthly Growth Rate of 2.3%. The numbers themselves are staggering. In the first five months of the year over 338 million hours of content was broadcast and over 10.1 billion hours watched. These numbers bode well for games as they imply that throughout the year the level of interest in watching streamed gameplay content has not diminished especially when society opened, post pandemic, and pressures from other media entertainment has increased.
Conclusion
To conclude what do these six indicators tell us about the state of the industry so far in 2022?
I would say that when looking at all six indicators collectively the message is positive, if a little muddled. It is obvious that the correction in spending from the pandemic induced high of 2019 and 2020 is in its second year but that correction has not resulted in a disinterested audience, on the contrary because sales figures for new games tell a different story. Most publishers are not yet feeling the pinch and the economic downturn has not yet affected their ability to generate growth in revenue. The mid-year gap in full game video game releases is unfortunate and a lot of that is due to bad luck in timing. The interruption in game development due to the pandemic has not helped (Chris Dring’s article What Has Happened To All The Video Games? explores this in some detail) and for many publishers they are stuck in a holding pattern until their new games see the light of day.
Overall, these indicators do not say the video game industry is “recession proof”, but so far, the industry has demonstrated resilience and given the state of the economy right now, resilience is as good as it gets.